Welcome to acacia’s documentation!
acacia is a Python tool that produces clustered polygons from two rasters. If this seems like a general statement, it’s because it is.
Although originally designed to tak input from our other tool biota, acacia works the same regardless of the data you feed it.
All you need to run acacia are:
One raster of a given continuous quantity (e.g. biomass in 2010), representing the initial state your your data.
One raster representing the change between your initial state and the final state of you data (e.g. change in biomass between 2010 and 2015).
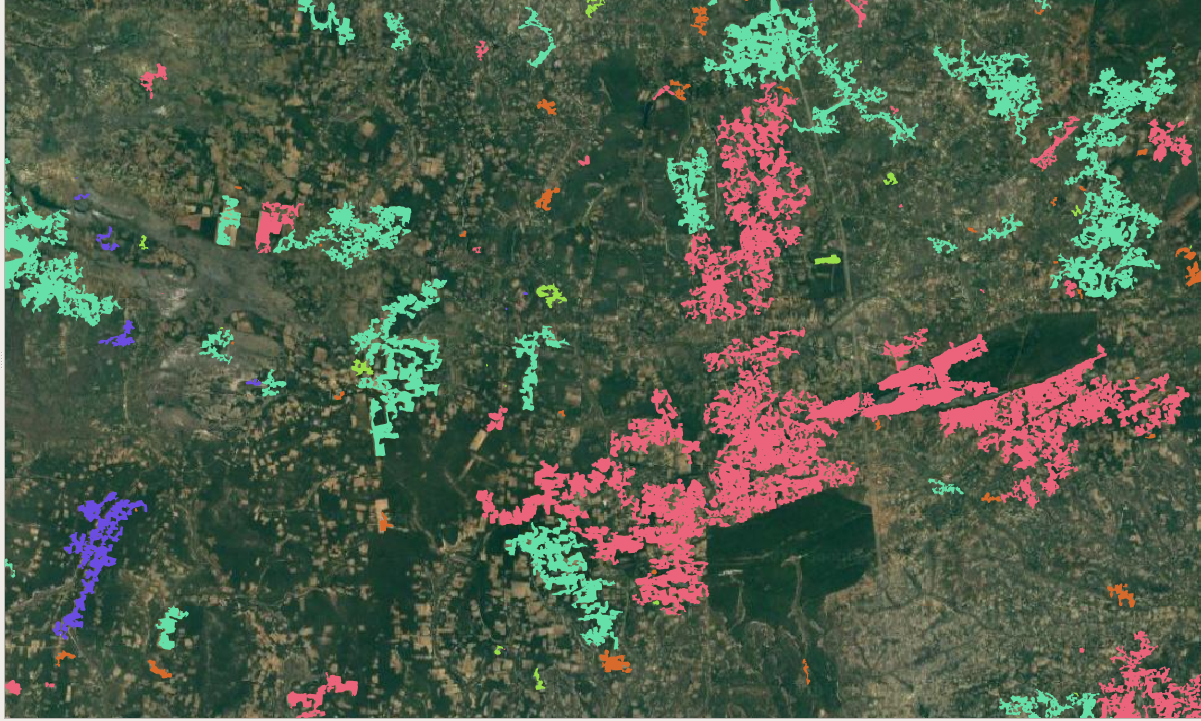
Using these 2 rasters, acacia produces polygons of significant negative change, clusters them according to their properties (both geometrical and taken from the rasters) and outputs a shapefile summarizing all these analyses, as well as a few handy figures.
acacia offers the possibility of adding a third input in the form of a shapefile, but we’ll come to it later.
Who do I talk to?
Written and maintained by Guillaume Goodwin (g.c.h.goodwin@sms.ed.ac.uk) and Samuel Bowers (sam.bowers@ed.ac.uk).